SQL SERVER – Performance Tuning – Part 1 of 2 – Getting Started and Configuration
Performance tuning is always a complex subject whenever one has to deal with it. When I was beginning with SQL Server, this was the most difficult area for me. However, there is a saying that if one has to overcome their fear one has to face the fear first. So I did exactly this. I started to practice performance tuning.
Early in my career I often failed when I had to deal with performance tuning tasks. However, each failure taught me something. It took a quite a while and about 100+ various projects before I started to consider myself a guy who knows something about performance tuning.
Every performance tuning exercise gave me new experience. I firmly believe in “Practice makes perfect” when I am involved in performance tuning projects. There were times when I could figure out problems by just looking at few configurations and settings. When asked how I knew this so quickly my usual answer was “experience.”
Quite often I get requests to share my expertise in performance tuning. This is when I wish it were easier. If I had to go back and do one thing during my whole career of performance tuning, I would document every single performance tuning rule that I have come across in my life. Once everything is documented, the expertise of performance tuning can be measured, and the results of these rules can give additional confidence while doing performance tuning.
Performance tuning used to be the responsibility of the DBA and developers who built the code. However, recently I have seen in many organizations that there are dedicated experts who are responsible for performance tuning of the server. Often they have to manage multiple servers and heterogeneous RDBMS. The job is more stressful and more challenging than we know.
I constantly try to test out various aspects of performance tuning as well as all available tools which can help me select the optimal solution for performance tuning. I recently tested out DB Optimizer from Embarcadero and here is very short tutorial of how this tool can be used, as well few of the pros and cons.
Let us divide this article into the following subjects.
- Getting Started
- Analysis and Detection
- Tuning and Optimizing
Getting Started
In this section we will go over basic steps to install DB Optimizer XE2 Version 3.0. First of all go to DB-Optimizer-XE and download the trial version of the DB Optimizer. The installation is very quick and simple. The installation is pretty much selecting button NEXT … NEXT and Finish!
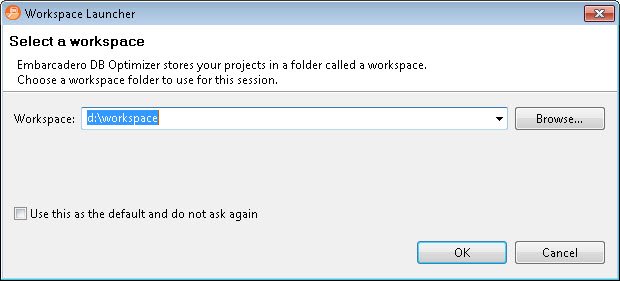
After you install and load the DB Optimizer, and right after the splash screen it will ask for the workspace where all the files of this optimization project will be saved. I think the most difficult part is over by now. From here the tool is very easy to use and self-explanatory. The very first screen has three sections: overview, tutorial and workbench.

I strongly suggest that if you are new to the tool then go over the tutorial. The tutorial is well organized and very detailed. It not only explains how one can do various performance tuning tasks but it often explains why they are done a certain way.
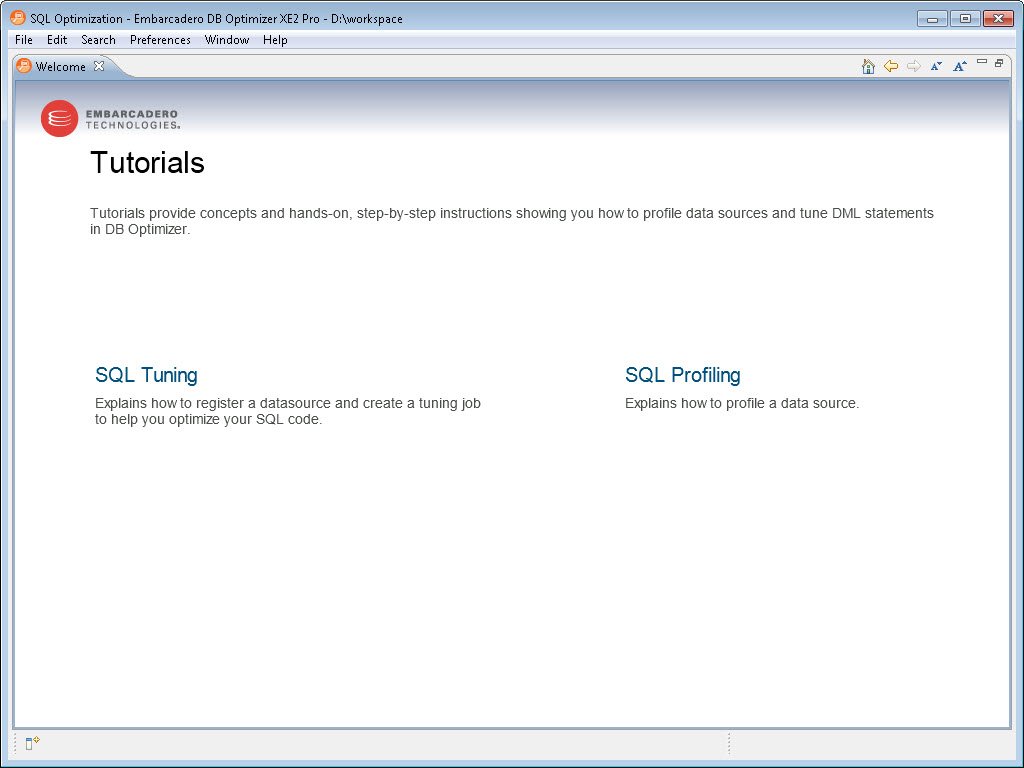
Once the tutorial is over or if you are an experienced user, head to the workbench directly. Workbench is the area where we will do various performance tuning related tasks.
Configuration

Here is one thing I have to point out: even though there is no wizard or step-by-step setup guide – the interface is very intuitive. For example, as soon as you start workbench, the very first screen is data source. Once data source is configured a simple right click on the data source is all one needs to work with performance tuning aspects.

This tool lets you connect to multiple data sources. We will select SQL Server as the data source and give it an easy name so we can refer to it easily in the future. One specific thing worth noting is that while connecting to the data source, it lets you specify what kind of data source you are connecting to. Are you connecting to Development, Test, QA or Production? This is very essential so that we do not deploy changes to the incorrect server while we are performing various tasks with DB Optimizer.
The next step is to provide details of the connection string and check if the connection is successful by clicking on the Test Connection button at the bottom. If the host address along with username and password is correct, the connection will pop up with a “Connection was successful” message.
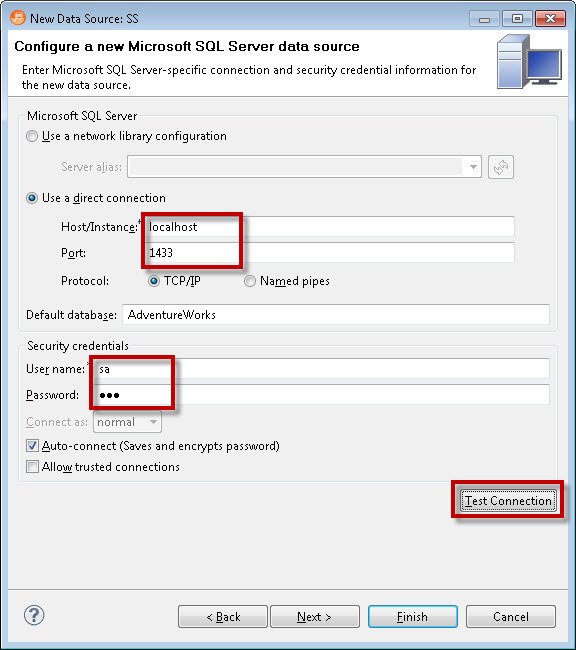
Click on Finish after the connection is successfully made to the data source. It will register the data source and bring up the same screen where you started.

Expand the data source which we have registered. Once you expand you will see every single object listed under the data source.
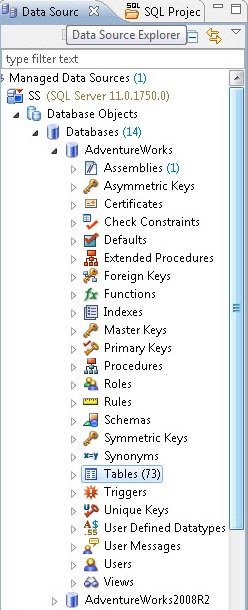
After configuring the data source, the next task is to configure the profile.

Profile configuration is a very easy process and we define where we will be storing various captured data in the database as well what data source will be captured.

Once the data profile is configured go ahead and click on Profile. I think we are now 100% done in configuring the setup. The next step is to analyze our profiled data.
In next blog post we will continue with the second part of Analysis, Detection, Tuning and Optimizing. Till than you can download and configure DB-Optimizer-XE.
Part 2 of 2 – Analysis, Detection, Tuning and Optimizing
This second part of Performance Tuning – Part 1 of 2 – Getting Started and Configuration. I suggest you read the first part before continuing on this second part.
Analysis and Detection
If you have noticed that configuration of the data source and profile is a very easy task and if you are familiar with the tool, this can be done in less than 2 minutes. However, while configuration is an important aspect, appropriate analysis of the data is more important since that is what leads us to appropriate results.
Once configuration is over, the screen shows the results of the profiling session. Now the screen will start returning information from various sources in detail. After a few minutes it will display the exact information regarding what is going on under the hood of SQL Server.
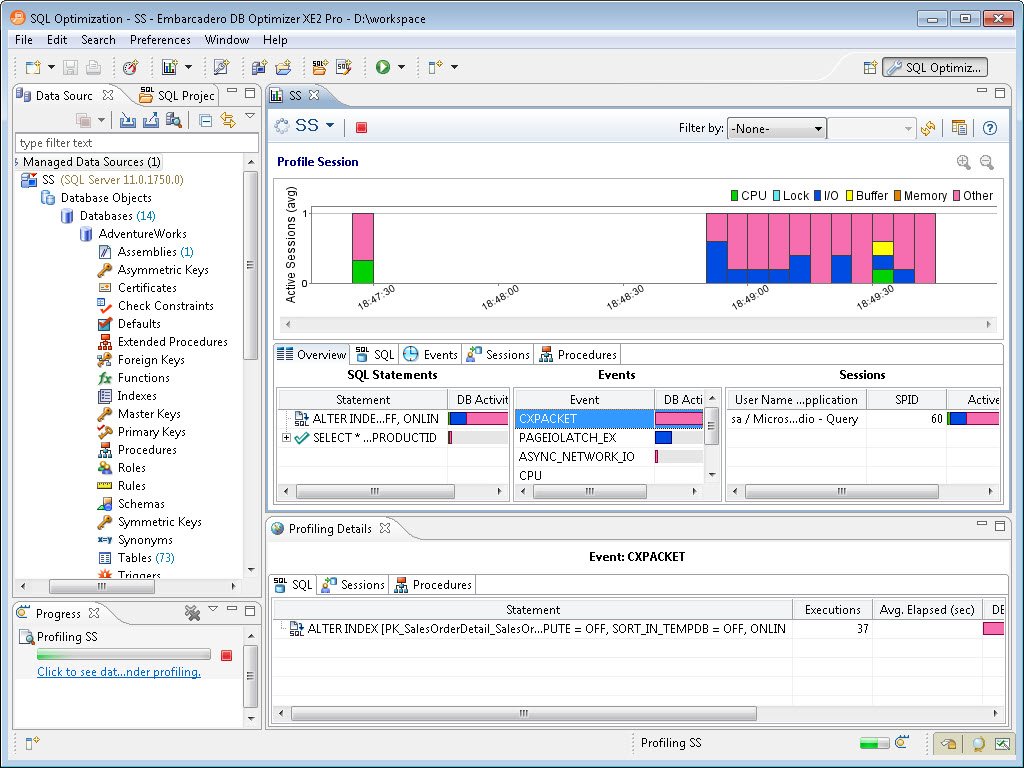
Let us see each of the sections in detail. The left most part will show the SQL statement. The SQL statement section is extremely important, once expanded it will start showing exactly what is going on with respect to the SQL Server load in the system.
Identifying the Most Critical Query
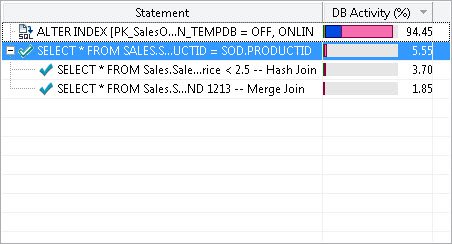
A frequently-asked question by developers is: in real systems there are millions of queries executing in a given time period. If I have to begin tuning queries, where should I begin, and which query should I tune to give me maximum return with respect to the performance? Well, this is the precise question the SQL Statement area attempts to answer. It displays the queries in terms of the percentage of DB Activity. One can easily narrow down the query which is most expensive and focus on tuning the query.
Identifying Wait Statistics
This is another very popular aspect covered in the tool. If you know me, I am a big believer in SQL Wait Stats. When SQL Server is executing any task, and if for any reason it has to wait for resources to execute the task, this wait is recorded by SQL Server with the reason for the delay. Later on we can analyze these wait stats to understand the reason the task was delayed and maybe we can eliminate the wait for SQL Server. It is not always possible to remove the wait type 100%, but there are a few suggestions that can help. Here is the SQL Server Wait Stats ) series which I have written which explains all the major wait stats in detail.

Profiling Active Sessions with Resources
Well, personally I found this section the most useful and insightful. The biggest challenge is to identify which resource is bottlenecked in SQL Server. It is quite possible that all the queries are running at their best. There is nothing left to tune with respect to the query, but still the performance is very slow. The reason can be that resources on the system are bottlenecked. The scarcity of resources is creating the performance degradation scenario. In this top horizontal section of the window it clearly maps what time exactly which resource was utilized. The same colors are also used in the SQL Statement, Events and Sessions section which help visually map queries, resources and events.
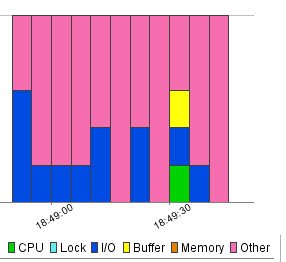
I believe once the query profiling is done, keeping resources in mind, the performance tuning task is much easier. Here are the steps a developer should be taking when they are trying to optimize queries using DB Optimizer:
- Identify slow query or offending query
- Identify the resource bottleneck using active sessions and events
- Tune the offending query
It is equally important to tune the offending query as much as it is to identify the offending query. In the next section we will see how DBOptimizer can help optimize the queries in a few clicks.
Tuning and Optimizing
When we identify the offending query our next intention is to optimize the offending query. To tune any query we need to understand all the details surrounding to the query. What impressed me the most about this tool was that it’s instant database-level analysis. Once we select the query to tune we can also see various deep down profiling details for individual queries as well.
First go to SQL statement and click on SQL Text. It will give the exact statement which ran, with all the parameters. The next tabs explain events, sessions and procedures which were associated with SQL Statement.

Once the profiling details associated with any query is understood the next important task is to tune the query and understand the execution plan. In the SQL Statement query if you right click there are two options visible, 1) Explain Plan and 2) Tune
Explain Plan
You can see that now we are entering into specific details related to the query.
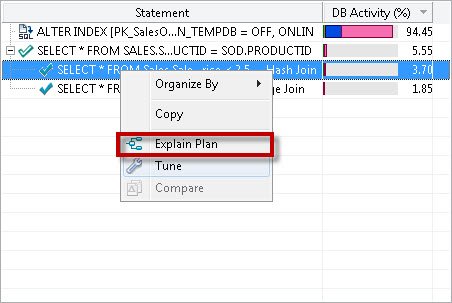
In this section you can see very clear tabular formatted explanations of the execution plan. There is various information associated with the execution plan. Personally I prefer to see the execution plan in XML format as it explains various details. However, when in a hurry it is not always possible to spend time on XML. There are cases when any organization does not have time and bandwidth to do this.
The Execution Plan section is not only important for understanding queries but it is a great learning tool as well. I personally spend quite a lot of time on the execution plan. I spend time even on good queries as it is important to know what made the query so good. I think the Explain Plan can aid in learning this technique. Pay attention to I/O Cost, CPU Cost, Row size, Rows and Execution count.

Tuning Execution Plan
I think this is the most interesting part of the DB Optimizer tool. It is called TUNE! I think in one simple word it says what it does and when I saw this for the first time, I just felt like clicking on it. There are cases when a developer or DBA does not want to dig deeper in the scenario, or there are cases when they just want to try alternate scenarios as well. I believe this is a good place to start. Just hit Tune and let DBOptimizer suggest the best plan.

Though I was intrigued to hit Tune, I was bit wary to click it as I was not sure if the tool would then execute any T-SQL statements or tune script against the database. I am the guy who trusts anybody and everybody, but even then, I always like to at least know what is going to happen when it is about my most critical database. Fortunately, when I clicked on Tune, it showed me an overview screen. Where there were two options provided: 1) Generate Cases and 2) Perform Detail Analysis.
This was a very clean and easy to understand interface. The part I liked was generating cases. Often when I am developing T-SQL I want to try out various options but there is always a deadline to finish the project, and it makes sense to spend a limited amount of the time on any query as Return of Time Invested is very important as well. I think this tool can automate this mundane task and help figure out what the optimal solution is.

Clicking on the analysis tab also provides various index options. Additionally, it provides the cost for each index so you know which will be most efficient for a specific query.


If you click on Create Index it also generates the index for you, which you can apply to your database. I think there are many other features which we can discuss here, if I had the time. Additionally, please note that creating an index may or may not be the optimal solution. It is quite possible that a query re-write may solve your problem or even dropping unused indexes is the solution. Anyway, this tool gives lots of suggestions along with their impact, this makes decisions much easier.
Caution
I have always believed in the philosophy that there is no replacement for the human brain. No matter the advancements in artificial intelligence, there are places and cases when the human brain makes better decisions than any machine or tool. Though I have found DB Optimizer very well balanced and organized, I will also watch its decisions. It is great tool which so far has proved itself, but just like any other tool, it should be used with human intelligence. Just like Missing Index DMV gives plenty of Indexes to create but the DBA usually selects the most useful index and creates only those which are necessary. In the same way, there will many solutions this tool will suggest along with their impact. It is our responsibility to select the most powerful solution, keeping overall server health in focus.
Top 5 things I like the most
There are quite a few things which I really liked it but I decided to list the top 5 here to keep it sharp and short.
- Clear and easy to navigate interface
- Index analysis is fairly accurate and very informative
- Execution plan layout and arrangement is very well organized
- Painless, simple installation
- Well documented help and community support
Top 3 things for wish list for next version
Nobody is perfect. After using this tool for a long time, I have a wish list for this product. I am listing the top 3 items from this list.
- Further explanation of the wait stats
- Do not generate case – currently it generates various cases, there are times when I do not want cases to generate. I think this feature is a bit over-ambitious. Basic users who this tool targets may never need it
- Additional reference materials for the execution plans
Summary
Overall, DB-Optimizer-XE is indeed a performance tuning flagship product from Embarcadero. As I said earlier, the right tool can make life easier for experts as well remove all the uncertainty from a performance tuning project. I also found this product extremely easy to use, with a very clear user interface and even some fun options (like Tune). I think anyone who is interested in performance tuning should at least give DB Optimizer a try to see if they like it.
DB-Optimizer-XE has a lot of great features, but it’s not perfect. Keep in mind that you have to be smarter than the tools you use, so you can’t rely on one program alone to solve all your problems. However, with that said, I highly recommend this program to anyone who is facing performance tuning now and in the future.
Reference: Pinal Dave (https://blog.sqlauthority.com)
没有评论:
发表评论